


Rents in a Fully Constructed NYC
What happens if every developable lot allowed by current zoning were built to maximum size

Bottom line: Even if NYC magically built every single feasible development project by 2030 rents would only drop to 2022 levels, still unaffordable for most New Yorkers. Our zoning is so restrictive that even maximum buildout barely moves the needle.
I previously analyzed1 what portion of all land in NYC is currently zoned such that it is feasible to construct a larger building on the given lot. If we were to construct every such lot to it’s maximum size we would go from a city with 5.6 billion ft² of total constructed floor area to approximately 6.8 billion ft², an increase of around 22%. Let's explore the unrealistic but revealing scenario: what would happen if NYC built that entire 1.2 billion ft² by 2030?
Population Change
If population density per square foot stayed constant, we'd expect NYC's population to grow by 1.8 million, from 8.5 to 10.3 million. However the expected drop in rent would lead to residents being willing to buy more space with the money they are saving on rent. We would likely see a smaller increase to around 10 million people. This would just barely ensure that New York State grows at the same rate as the rest of the United States as a whole, keeping all our congressional seats as opposed to the current expectation of losing 3 electoral seats.
Rents in 2030 if Nothing Changes
Calculating rent changes requires understanding our current trajectory. Since 2010 the Streeteasy rental index has gone from $2124 to $3656 (+72%), while median asking rent has gone from $2695 to $3900 (+45%). The rental index tries to account for changes in the quality of apartments being rented. The rental index shows how much an equivalent apartment costs over time. Since NYC apartments have gotten smaller as prices rose, both metrics matter.
While we do care about the price of an equivalent apartment, we also care about the amount that rent as a whole has changed regardless of apartment makeup. Weighting the 2 measures equally gives us 59% growth over 15 years, or 3.1% annually. But recent trends are worse. Since mid-2017, rents have grown 4.4% annually. Splitting the difference conservatively, I project 3.8% annual growth.
Under current trends, we can expect rents to be at least 20% higher by 2030.
Rents in 2030 if NYC built to it’s max feasible size
The traditional method to calculate what would happen to long run rents as a result of a 22% supply shock increase is to look at the elasticity of demand. We calculate this from National Bureau of Economic Research’s “Uncompensated Own Price Elasticity of Housing Demand”2 which is:
“If the price of housing services (i.e., rent) rises (or falls) by 1 percent and a household’s nominal income is left unchanged, by what percent will that household change the amount of housing it consumes?”
We take the inverse of that to find the amount the price (rent) will change if the quantity (supply of housing) changes by 1%.
If the total built area in NYC increases by 22%, we would expect rents to fall by 32%3. After accounting for the amount we expect rent to rise under the current trajectory, we find that if we built every developable lot in NYC to it’s maximum size market rents in 2030 would be 18% below rents today.
The last time we had rents at that level was early 20224, better than today but not like rents were “affordable” in 2022. With no developable lots remaining after this hypothetical buildout, rents would climb back to today's levels by 2033.
This reveals how absurdly restrictive our current zoning is: even magical maximum construction would only temporarily return us to 2022 pricing.
Evidence from other cities: Tokyo
The NYC democratic primary mayoral debate two nights ago (6/12) heavily featured discussion of housing, the question of how can housing in NYC be affordable was clearly on the minds of all candidates. Zohran Mamdani brought up the example of Tokyo, and how it was able to keep rents flat for the last 20 years. In the 17 years from 2006 to 2022 increased it’s number of dwellings (all housing units) from 13,915,800 to 17,807,700, an increase of 28%5. Rents rose just 3% over those 17 years6.
Rents in New York city went up around 61% in that same time period. If we had instead built to our maximum developable capacity as discussed above, we would expect only 11% rent growth which is much closer to Tokyo.
While Tokyo is a good example of how a much less restrictive zoning map and very strong levels of construction can lead to flat rents, we do have to discuss the differences between Tokyo and NYC.
While both cities have seen lots of demand for living in them, the population of Japan as a whole has been decreasing over this time period. While migration from rural towns to Tokyo have kept demand for living in Tokyo high, NYC has both the rural to urban population transfer and large US level population gains as an additional source of housing demand.
Evidence from other cities: Houston
Houston built 110,496 housing units from 1980-19847 for an increase of 20%8 in just 5 years. Monthly rents fell from $392 in 1982 to $316 in 1987, an almost 20% decrease. Simultaneously Houston’s population stayed almost exactly stagnant9. While we don’t see the 28% decrease in rents that the housing demand elasticity would predict from a 20% increase in supply, we do still see a significant drop.
After that oversupply Houston’s construction never recovered, and in the 40 years since then the city only built 17% more housing units from the 667,236 units it had in 1985. Subsequently, since 1985 Rents in Houston have gone up around 200%.
Houston shows both the power of supply and the consequences of stopping construction.
Evidence from other cities: Seoul
In the late 1980s as a response to severe housing shortages, South Korea Implemented a “Two Million Housing Plan”, in the five years from 1988 to 1992 South Korea built 2.1 million new housing units across the country. Seoul's housing stock grew from 1.25 million to 1.55 million units in these 5 years10, an increase of almost 25%. The broader metro area added another 600,000 units, and 1.2m were built throughout the rest of South Korea.
Unlike Houston, South Korea continued with significant housing construction through the early 2000s. As a result of this concerted housing push, housing costs were significantly reduced in real terms from their 1990 peak:
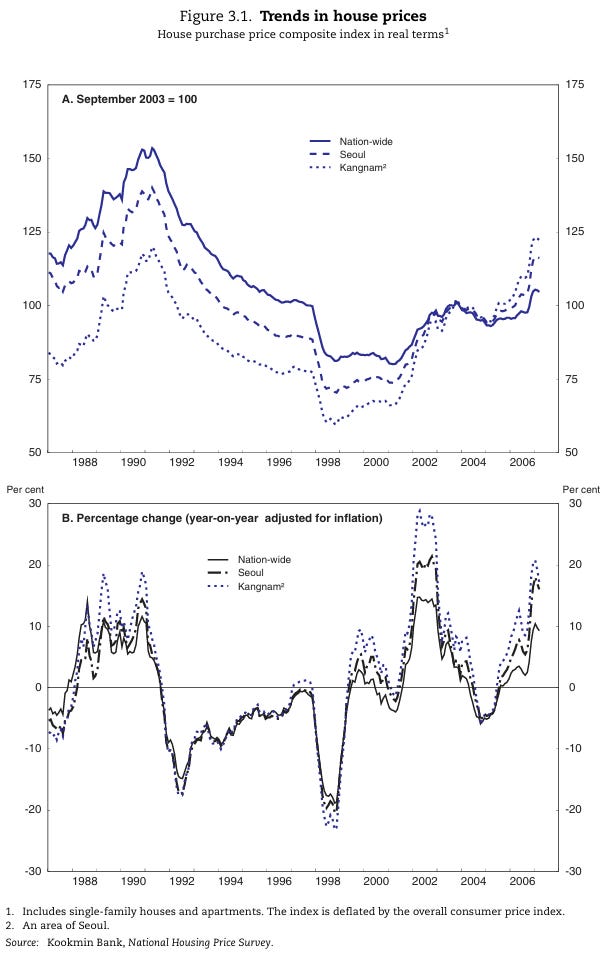
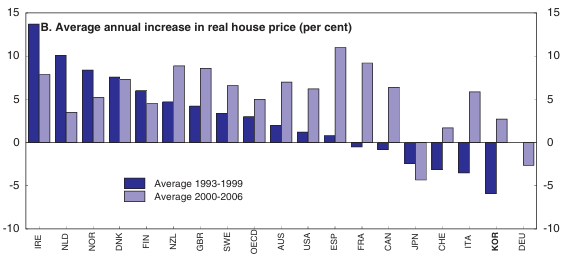
If we compare real house price changes in that 1993-1999 era, South Korea had an average annual decrease of 6% every year, despite a significantly growing population. Significantly better than the what we had in the US of 1% increase ever year over that period11:
We see something like a 31%12 decrease in the real cost of housing during a period in which the ratio of houses to households went up by approximately 20%. This is very close to what the Uncompensated Own Price Elasticity of Housing Demand would predict.
Once again there are definitely differences between NYC and Seoul/South Korea as a whole. But what Seoul in the 90s definitely has in common with NYC now is a huge increase in Demand to live in the city. If anything the level of demand to live in Seoul in the late 20th century is higher than NYC now. South Korea was rapidly industrializing and huge swathes of it’s population wanted to live in the capital. From 1980 to 1990 Seoul’s population increased 27%13.
Takeaways
Large housing supply increases demonstrably reduce costs across different cities and contexts. But NYC's zoning is so restrictive that even maximum possible construction under current rules would barely dent our affordability crisis. Even magically constructing every feasible lot to develop by 2030 would likely only bring us back to 2022 prices.
NYC used to be a city of construction, as discussed in this recent mayoral debate we built the Empire State Building in 13 months. We built the first subways in 4 years, after approving them in 1 week14. Construction Technology has certainly improved since then, but our zoning resolution15 remains stuck in an outdated 1961 framework, hampering our ability to grow and thrive.
While we are starting to see positive signs both in the form of City of Yes16 and a slate of mayoral candidates that are more pro new construction17 than any slate we’ve seen in years, escaping our housing affordability crisis will require more than incremental fixes. It demands the kind of bold zoning reform that recognizes the scale of our problem and acts accordingly.
In this research paper, table 1 column 3
22%*1/-.697, the -.697 being the Uncompensated Own Price Elasticity of Housing Demand
Based on Streeteasy’s citywide median asking rent and rent index.
Counselors of real estate historical Houston apartment data
According to this article, which is supported by this census data
OECD Economics Survey Korea, page 63 and 69
5 years of an annualized 6% decrease per year.
https://zoningresolution.planning.nyc.gov/
https://nyc.legistar.com/LegislationDetail.aspx?ID=6888427&GUID=4B132BCA-7483-462C-8588-B6B921596C48&Options=&Search=%5D
https://x.com/NYCNewLiberals/status/1932562863425564677